-

Adversary Simulation
Our best in class red team can deliver a holistic cyber attack simulation to provide a true evaluation of your organisation’s cyber resilience.
-

Application
SecurityLeverage the team behind the industry-leading Web Application and Mobile Hacker’s Handbook series.
-

Penetration
TestingMDSec’s penetration testing team is trusted by companies from the world’s leading technology firms to global financial institutions.
-

Response
Our certified team work with customers at all stages of the Incident Response lifecycle through our range of proactive and reactive services.
PART 1: How I Met Your Beacon – Overview
Introduction
Its no secret that MDSec provides a commercial command-and-control framework with a focus on evasion for covert operations. With this in mind, we are continuously performing on-going R&D in to techniques to not only hide a beacon, but also detect them. Indeed, some would argue that the best way to build an elusive beacon, is to not only understand the ways in which your opposition detects you, but to try and find new ways that they could detect you in the future.
During this research we will outline a number of effective strategies for hunting for beacons, supported by our BeaconHunter tool that we developed to execute these strategies and which we intend to open source in due course. In the following posts to this research, we will then step in to a number of case studies for applying these detections to a variety of both commercial and open source frameworks.
This material was originally discussed at x33fcon 2022, the slides for this material can be found here.
Approaches for Beacon Detection
While there are a variety of different approaches for detecting a beacon running inside your network, we will focus less on the functionality of specific post-exploitation functionality, and more on generically identifying the beacons being residing or being loaded in to memory.
Behaviour
The behaviour of the beacon whilst its not only operating but also loading can give rise to detection opportunities for defenders. Many of the commercial frameworks are closed source, and as such some behaviours cannot trivially be changed, allowing defenders to create signatures aligned to these actions.
A great example of this is how the beacon loads itself and its dependencies; lets look at how behaviour associated with image loads might provide detection opportunities for defenders.
In order for a beacon to provide a rich post-exploitation framework, it often relies heavily on libraries native to the operating system, allowing the developer to keep the beacon size as small as possible by avoiding statically bundling many dependencies.
From analysing a number of beacon frameworks, we’ve noticed that many of these will proceed to load all dependencies required for the core beacon at load time as opposed to on use. In some cases, this leads to a unique sequence of events occurring on the endpoint, which can be trivially signatured by defenders.
For example, it is common to see beacons leveraging the native Windows HTTP libraries for egress beacons by loading winhttp.dll and wininet.dll; these may stand out as anomalies when loaded in to processes that would not normally perform HTTP interaction. Furthermore, some beacons have been noted to load libraries that are used more sparsely such as credui.dll, dbghelp.dll or samcli.dll.
Using these sequences of DLL loads, it becomes feasible to build signatures using EQL rules to detect when the beacon is executed.
For example, using an EQL rule similar to the following, it is possible to detect or hunt for all processes loading the credui.dll, and winhttp.dlls within a short period of time:
sequence by Image with maxspan=1m
	[any where ImageLoaded == 'C:\\Windows\\System32\\credui.dll']
	[any where ImageLoaded == 'C:\\Windows\\System32\\winhttp.dll']
This category of detection can of course be avoided by beacons that are designed to be modular or load dependencies on use or with delayed loads.
In Memory Detections
In many cases, beacons may remain memory resident in order to avoid on disk detections. The beacon is typically injected in to memory by a loader, which will create a new or hijack an existing thread in which to run the beacon in.
A typical loading process for the beacon may look as follows:
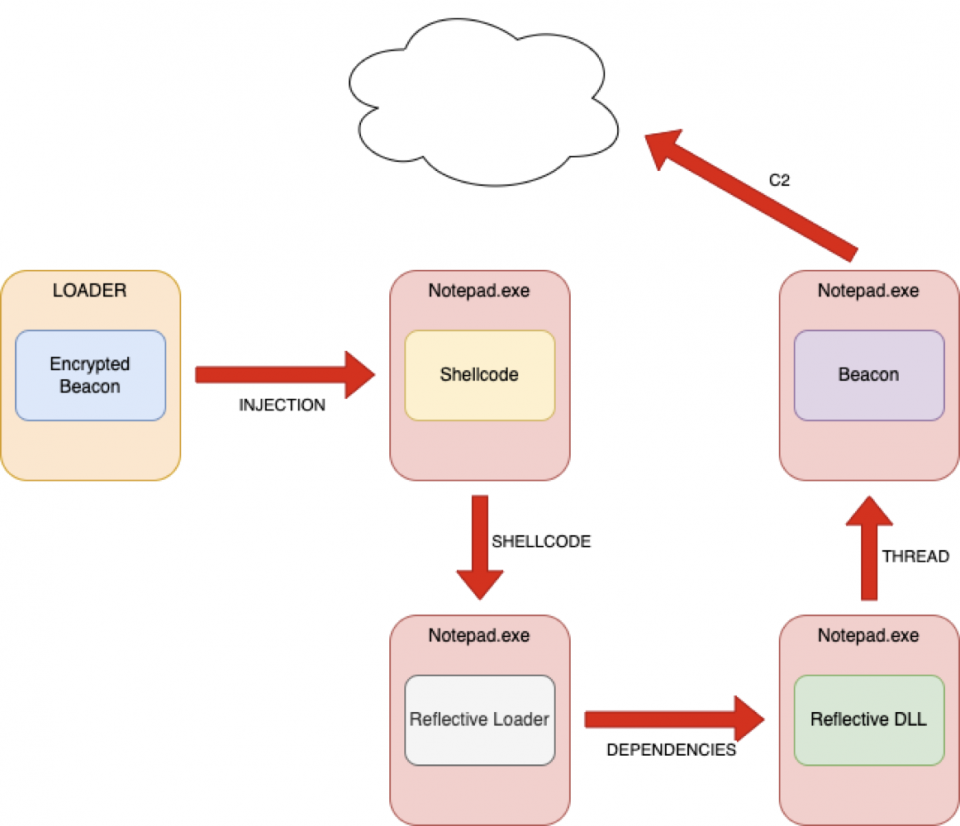
Once the beacon is running in memory, through analysis of the process there are often a number of indicators that we can leverage to detect the beacon; let’s look at some approaches for in-memory detections.
Signatures
Perhaps one of the simplest, but most effective strategies for detecting in-memory beacons for known malware is through signature detection. While many anti-virus engines and EDRs implement their own memory scanning routines, threat hunters can readily achieve comprehensive memory scanning using Yara rules.
A simple Yara rule that can be used with the yara64.exe command line utility might look like this, which would match on detecting any of the three listed strings in memory:
rule howimetyourbeacon
{
meta:
    author = "domchell"
    description = "Simple yara rule"
strings:
    $a = "How"
    $b = "I"
    $c = "Met"
		$d = "Your"
		$e = "Beacon"
condition:
    3 of them
}
Creating Yara rules for strings/data embedded within the beacon, or code from the .text section can conceptually be used as an effective technique for detecting known in-memory malware.
Elastic have done some great work in the past on how this can be leveraged to detect Cobalt Strike in memory and is recommended reading for how these techniques can be applied in practice.
To evade such memory scanning, beacons can employ a number of techniques to obfuscate their footprint in memory, including replacing known strings such as can be achieved using Cobalt Strikes strrep malleable profile option and/or the use of a obfuscate and sleep strategy such as the one we use in Nighthawk to protect all strings, data and code of the beacon while sleeping.
Memory Hooks
In order to circumvent controls or change how a process might function, beacons (or the operator) may apply hooks to certain functions in memory. These hooks can leave hidden traces that can provide threat hunters opportunities to reveal hidden beacons. Lets examine some examples of this behaviour.
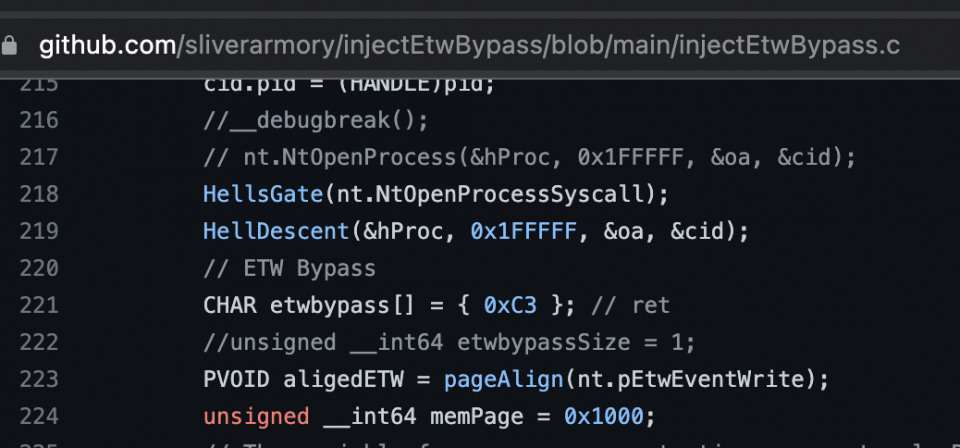
ETW and AMSI Patching
Patching security controls such as AMSI and/or impairing telemetry obtained through Event Tracing for Windows is no secret in the offensive community, indeed we have previously blogged about these tactics in the past.
These patches are typically applied by modifying memory; let’s look at two examples taken from the Sliver C2 armory:
https://github.com/sliverarmory/injectEtwBypass
https://github.com/sliverarmory/injectAmsiBypass
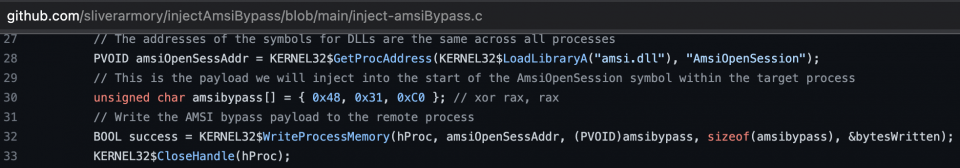
As we can see in the screenshots above, both of these examples will cause the beacon to apply a patch to either the ntdll!etwEventWrite or amsi.dll!AmsiOpenSession functions.
With this in mind, a low noise detection opportunity arises simply by hunting for processes with these patches applied to these and other commonly patched functions such as AmsiScanBuffer or SleepEx which a hook is applied to by Cobalt Strike’s thread stack spoofing feature from the arsenal kit.
Copy on Write Modifications
As noted above, it is not unusual for beacons to apply patches to process memory which can create detection opportunities for hunters. The fruitfulness of these hunts can however be reduced should the beacon remove the patches once the post-exploitation operations have been performed. For example, the implant may apply an AMSI patch prior to executing a .NET assembly in memory, then following execution revert patch to its original opcodes. This approach is moderately more intelligent than simply leaving dangling patches in-memory.
However, in order to avoid duplication, Windows will back common DLLs to physical memory that is shared across running processes. Should a beacon or the operator perform an operation that applies a patch to one of these DLLs, a copy on write operation will occur, making the page private to that process. Using the QueryWorkingSetEx API, we’re able to query information about the pages at a specific virtual address of a process. Within the returned PSAPI_WORKING_SET_EX_INFORMATION structure is a PSAPI_WORKING_SET_EX_BLOCK union that indicates the attributes of the page at the queried address. Within this union we’re able to determine if a copy on write operation occurred on the page by the return value of the Shared bit. This technique is used by memory scanners such as Moneta and is highly effective, at detecting in-memory patches, even if the original patch value is restored.
There are however some risks of false positive in applying this technique at scale in that it is not uncommon for EDRs and anti-virus software to apply their own in-memory hooks, meaning that they can invalidate some of the value we can obtain from looking for copy on write operations. However, to perhaps reduce the risk of false positives, we can apply more intelligence to this by resolving the exports on the modified pages and applying a greater weighting to functions that EDRs do not typically hook such as EtwEventWrite or AmsiScanBuffer.
Anomalies in Threads
As previously noted, once the beacon is operating in memory it will typically live inside one or more threads, depending on if the beacon is synchronous or asynchronous. Anomalies associated with these threads can provide high signal indicators of beacon activity, in particular when combined with other indicators or in conjunction with each other. Some common suspicious thread related indicators include the following:
- Unmapped memory: threads that originate from virtual memory, without being backed by a DLL are a classic indicator for an injected thread. These threads can trivially be detected by hunting for threads with memory regions with a MemoryType of MEM_IMAGE and a MemoryState of MEM_COMMIT. Alternatively, these threads are commonly detected by EDR inspection through kernel callbacks for thread creation APIs. This indicator is well documented and many tools exist for hunting for this indicator.
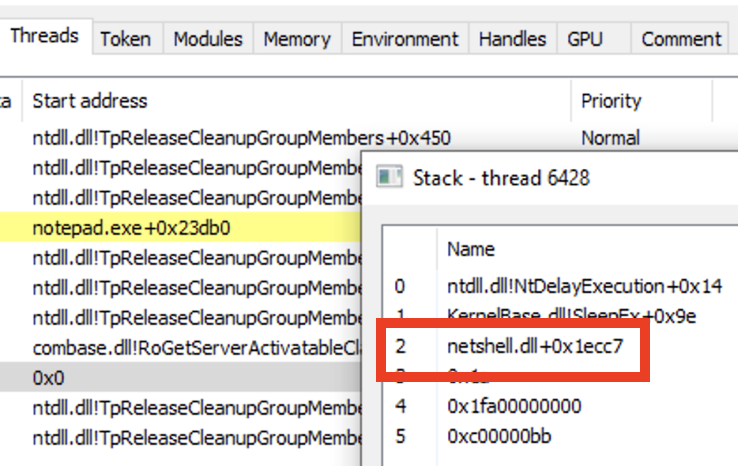
- Delay state: most of the time a beacon will be sleeping, before awaking to recover its tasking. To achieve this sleeping behaviour, windows API calls such as SleepEx are typically used; these put the thread in to a waiting state and will result in thread call stack containing calls to KernelBase.dll!SleepEx and ntdll.dll!NtDelayExecution. When combined with other indicators such as signs of module stomping (discussed later) or calls to virtual memory in the call stack, then this may provide some intelligence of beacon behaviour.
Attempts to evade detections around suspicious threads have become recently popularised, with several proof of concept and commercial implementations being published.
These implementations typically work by either truncating the call stack of the thread (for example by setting the frame’s return address to null) or by cloning the context of an existing thread. With this in mind, we have further indicators that we can hunt for to add to our metrics:
- Suspicious start address: one of the side effects of truncating the call stack for the thread is that the start address does not originate from an expected location. That is, threads will typically originate from ntdll!RtlUserThreadStart and kernel32!BaseThreadInitThunk, or ntdll!RtlGetAppContainerNamedObjectPath in the case of CLR threads. Hunting for threads that do not follow this pattern can be used as a suspicious metric for further analysis. Furthermore, the start address of the thread can also be considered suspicious and allude to potential truncation if a mismatch exists between the return value of NtQueryInformationThread(ThreadQuerySetWin32StartAddress) for the thread and the return address of the last frame.
- Distance between initial frames: as mentioned, the initial start address of the call stack will typically originate from a set number of addresses used to perform thread initialisation and creation. The distance between these initial stack frames is noted to be relatively consistent, and typically static between the first and second frames (e.g. ntdll!RtlUserThreadStart and kernel32!BaseThreadInitThunk). In the scenario where the call stack is truncated, the distance between these frames will almost certainly be variable.
- Cloned context: as noted, aside from truncating the call stack of the thread, one means of spoofing the call stack is to clone the context of a legitimate thread. This technique can be effective and relatively straightforward to implement; however there are some pitfalls that can be hunted for to give relatively good confidence of suspicious activity. Primarily, within the Thread Information Block for the thread, there are a number of pointers to various information about the thread; duplicates of these across threads, such as multiple threads having the same Stack Base (bottom of stack) and Stack Limit (stack ceiling) are a good indicator that the thread context has been cloned.
Page Permissions
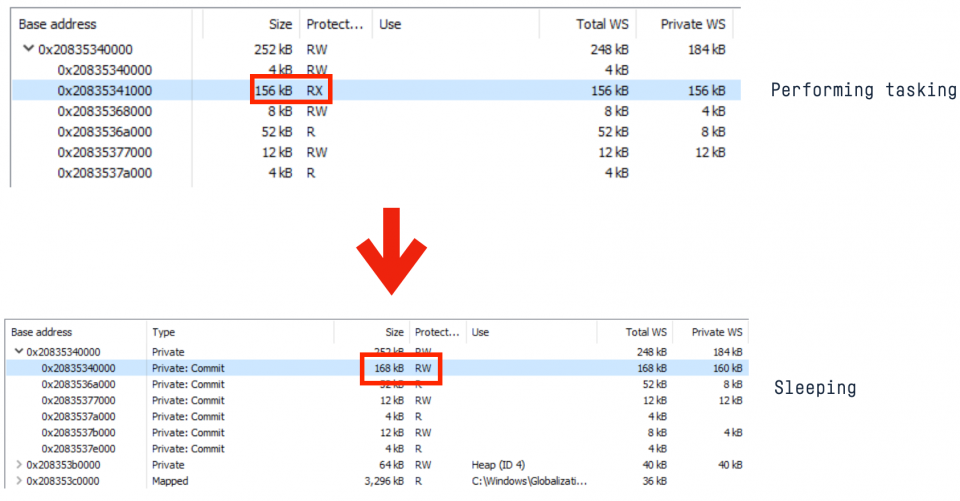
Generally speaking, the beacon will be operating from virtual memory, or from within a region backed by a DLL if module stomping.
In order for the beacon to recover and execute its tasking, the pages where the beacon is living need to have execute permissions applied to them. If this is from virtual memory and with the exception of jitted code (eg the CLR), it is highly irregular to see private committed memory with executable permissions.
For example, we can see in the following screenshot that the memory at 0x22f96c5000 is not backed by a DLL, it is marked as “Private:Commit” (i.e. virtual memory as a result of VirtualAlloc) and has the RX page permissions set:
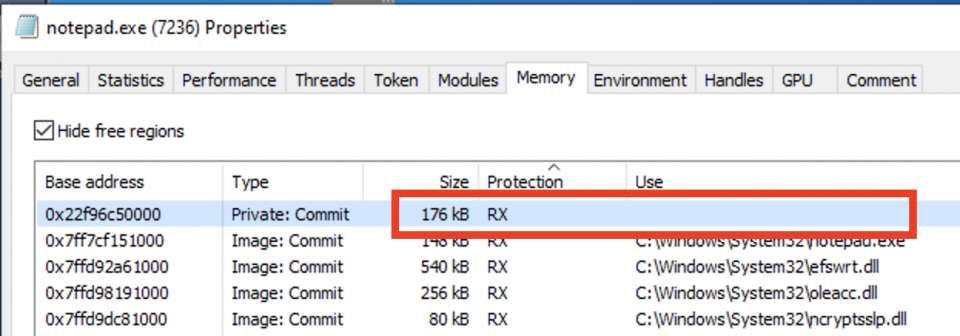
These indicators are a strong signal that there is a beacon executing in this region.
The challenge then becomes how can this indicator be avoided; well the simple answer is it cannot if your beacon is operating from virtual memory, at some point the beacon needs to be executing. The compromise is really to only maintain the executable permissions while the beacon is performing tasking, and leverage strategies to remove the executable permissions while the beacon is sleeping. Therefore, avoiding tradecraft such as SOCKS proxying can help to minimise the exposure of this indicator:
Several implants employ strategies for shuffling the page protections according to the beacon state, as well as several open source implementations such as @Ilove2pwn_’s Foliage, @c5pider’s Ekko, @mariuszbit’s ShellcodeFluctuation and Josh Lospinoso’s Gargoyle.
These strategies will typically leverage some form of event driven execution to sleep and wake the beacon, reengaging execution using ROP gadgets to call VirtualProtect and reset the beacon’s pages back to executable permissions. The Timer based technique discovered by MDSec’s Peter Winter-Smith and as used by Ekko, was originally reverse engineered from MDSec’s Nighthawk c2. In short, this technique works by queueing a number of timers using CreateTimerQueueTimer, which then when the event triggers will return to a previously defined Context record, executed using NtContinue and calling VirtualProtect to reenable the execute bit.
To understand this technique in greater detail, the original write up by @Ilove2pwn_ can be found here.
Module Stomping
Module stomping provides an alternate method of hiding your beacon in memory, avoiding some of the common indicators associated with beaconing from unmapped memory. Conceptually, to achieve this, a legitimate DLL that is unlikely to be used by the process is loaded and the beacon copies itself over the module; a thread is then created backed by the stomped code:
Cobalt Strike has offered this feature since its 3.11 release and is available using the “set module_x64 / module_x86” malleable configuration options.
While this technique can provide a number of OpSec advantageous, it does leave behind several indicators which we can reliable detect on:
- Perhaps the simplest technique for detecting this attack is comparing the contents of the module in memory with that which exists on disk. Any variations on the code sections will almost certainly allude to some suspicious behaviour. This process is of course relatively intensive as it would require all modules within the running process to be loaded from disk and compared against running memory.
- As previously described, modifications to in-process module memory will result in a copy on write operation occurring. With this in mind, the same logic for described for detecting memory hooks, can also be applied to detecting module stomping as overwriting the DLL in memory will lead to a copy of the DLL being made and the shared bit being cleared.
- There are several approaches that can be leveraged for performing module stomping, some involve leveraging existing Windows APIs such as LoadLibrary, while other more complex implementations may use custom loaders to map the DLL in to memory. Some techniques have known indicators associated with them, leaving resident traces in the PEB that can be used to hunt for this technique was high confidence. Examples of this will be discussed in greater detail later.
In conclusion, we’ve outlined a number of strategies for detecting in-memory beacons. In the next part of this series, we’ll begin to look at a number of case studies of real frameworks and see how we can apply these techniques.
This post was written by Dominic Chell.